
- Knowledge Base
- Performance
- Value
Business Intelligence

Until recently the digital tools needed to analyze and visualize large enterprise datasets were available only to large companies, this is no longer true. The technology behind Microsoft’s Power Platform has brought the cost of BI down to a level any size company can afford. I can help you take advantage of this, and give you the power to make better, more well-informed decisions.
I have over 20 years of experience designing BI analytical and visualization systems. The BI system I most often recommend for my clients is Microsoft Power BI. Power BI is the number one BI platform in the world, it allows me to give my clients the ability to make well-informed decisions and gain powerful new insights through interactive dashboards. It gives them the ability to have their financial, operational and business development information available to them in one normalized data source. And because Power BI operates in the cloud, they can access this information from anywhere on any device.
But my favorite Power BI feature is the fact that it delivers, just as I do, top-tier performance at a price almost any size company can afford.
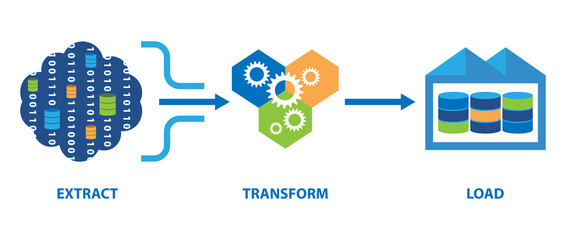
The first step in creating business intelligence, is a process known as ETL, it stands for “Extract, Transform, and Load”, it is the process of collecting data from your various databases and silos, and consolidating it into a single, consistent data source that can be easily accessed and used by a designated group.
To do this, you need to first extract it from its original source, this might anything from ERP system, to an Excel spreadsheet or text file. The data might come from another entity as part of a business merger, from such as a business partner, vendor or outsource service. You next need to transform the data by cleaning it up, deduplicating it, combining it, putting it into a consistent format to prepare it for the final step, which is to load it into the target database.

In the many years that I’ve been doing ETL the technology has improved greatly, but even better, the cost of ETL has gone down dramatically. Data warehousing data modeling was once only available to large companies with big IT budgets, now with the introduction of Microsoft’s Power Platform suite of products, this ability is within the reach of almost any size organization.
Today, my ETL tool of choice is Microsoft Power Query, which is the data transformation and mash up engine that supports the Microsoft Power Platform. It enables you to discover, connect, combine, and refine data sources to meet your all your analysis needs. It can allow you to connect to virtually any data source, including any type of SQL database, Excel, Access, online services such as Dynamics 365 and Google Analytics, JSON, CSV, .TXT,.XML or PDF files and many more.


As part of the same process, Power Query allows you to transform the data prior to loading it. Virtually any type of clean-up or normalization of the data can be done with Power Query. In addition the transformation process is automatically saved so that can be reused as often as needed.
The last step in the ETL process is to load the data into the data model. The powerful data compression engine Power Query uses makes it possible to store many millions of rows of data with out degradation of speed or functionality.

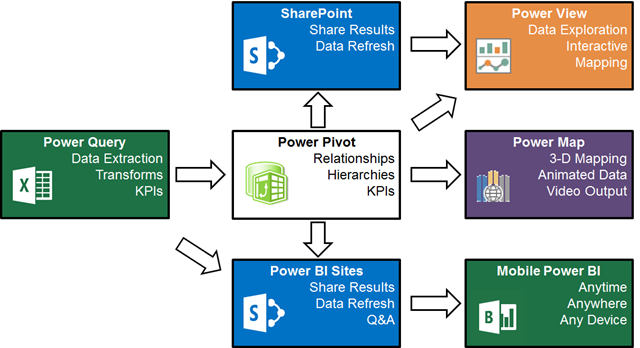
The next key BI component is data modeling, this is done in Microsoft Power Pivot. Data Modeling is fundamental to the BI process, it defines the relationships or connections between all the different data.
Data modeling also involves creating measures. Measures are the quantitative the statistics you want from your data, things like total sales,
number of employees, net profit by region, etc. Basically, they are the things you need to know to track the performance of your business, so they are also known as Key Performance Indicators, or KPI.
Power Pivot is also used by Excel, to create Pivot Tables. Pivot Table analysis is one of the most powerful ways to gain insight into what is happening in the business. Because of the improvements Microsoft has made in their data compression engine, Pivot Tables are even more powerful than they have been in the past because they can now be used to analyze much larger data sets.