
- Knowledge Base
- Performance
- Value
Excel Automation
I often wonder why companies are willing to accept the cost of under-performing systems and processes when one of the most powerful automation tools, VBA, is readily available to them in Excel. VBA has been a game-changer for me in my professional career, let me put it to work for your organization.
Management Reporting Systems
I’ve been doing management reporting for more than 30 years, it’s probably the thing I’ve done the most of in my career. My favorite way to do it is with Excel VBA. I typically make a connection to the back end of my accounting system, extract the required set of records, massage them with VBA and render them in a spreadsheet. This method is fast, reliable and flexible, and has never failed me yet.
I’ve done every kind of management reporting there is, basic financial statements, KPI dashboards, order input, revenue and backlog analysis, cash flow, budget versus actual, labor utilization, pricing and quotation systems, product line profitability, indirect rate analysis, project reporting, valuation analysis, AR aging and DSO, inventory turns, sales and use tax and many more. I’ve done all of these and more for my clients with great success using VBA programming. I also give them a friendly and intuitive user interface that makes it simple and easy for them sort and filter, so they get to the heart of the matter to get the job done quickly and easily.
Interactive Dashboards
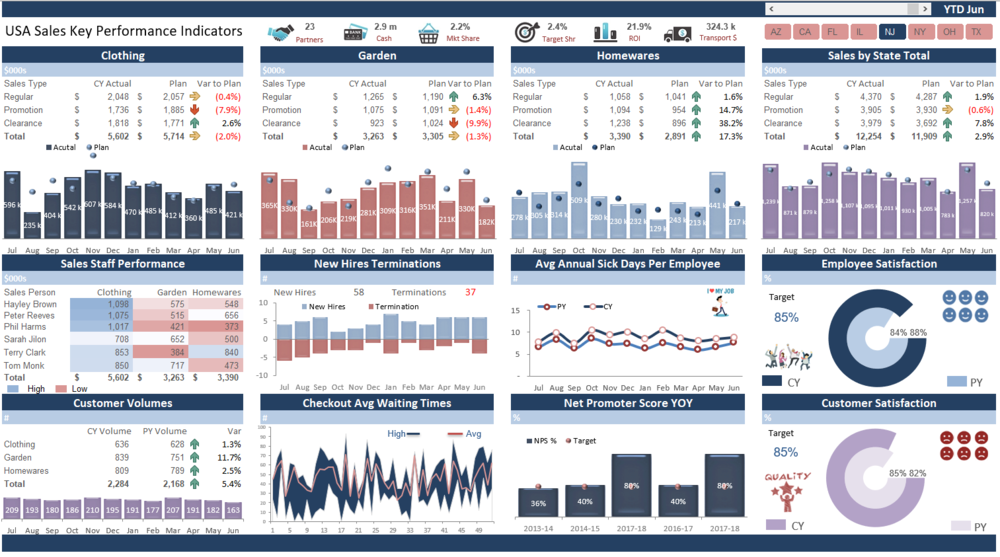
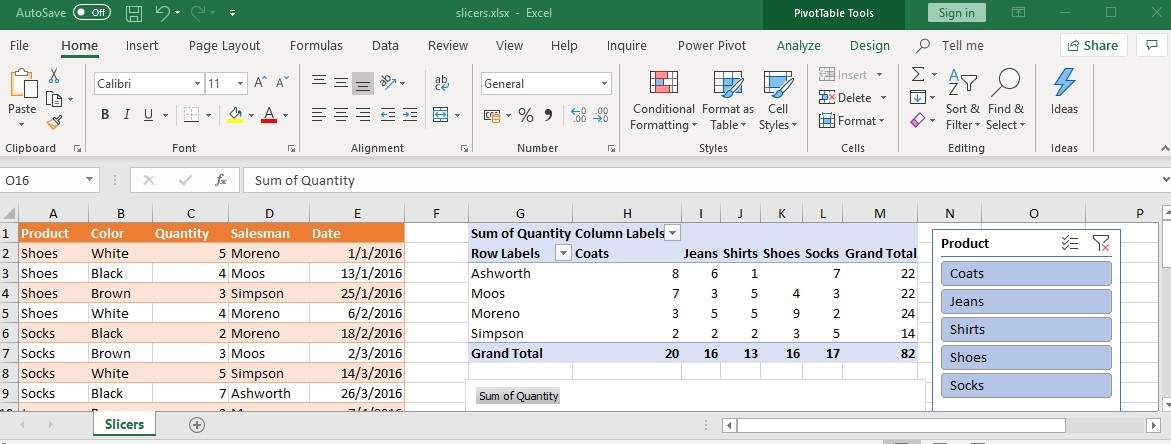
Excel has many great features to create dashboard visualizations, however I have found the best tools to create powerful dashboards are a PivotTables, PivotCharts and Slicers. When these are used in combination with VBA’s ability to dynamically query your data source, it gives you the ability to get to what you’re looking for easily, present it any way you choose and quickly refresh the dashboard as new data becomes available.
Dynamics 365 CRM integration
Using VBA code you can sync Excel with your Dynamics 365 CRM to automate the process of posting updates to it. This gives your field reps a more familiar tool and makes it easier for them to keep your system current.
Just as does with your ERP, VBA also gives you on-demand access to your CRM. This allow you to have it wherever and whenever instantaneously. It also allows you to combine CRM data with that of other systems and create powerful reports, analytics and visualizations. These can then be back-loaded into the CRM interface making the information readily available to CRM users remotely.

Smart Spreadsheets
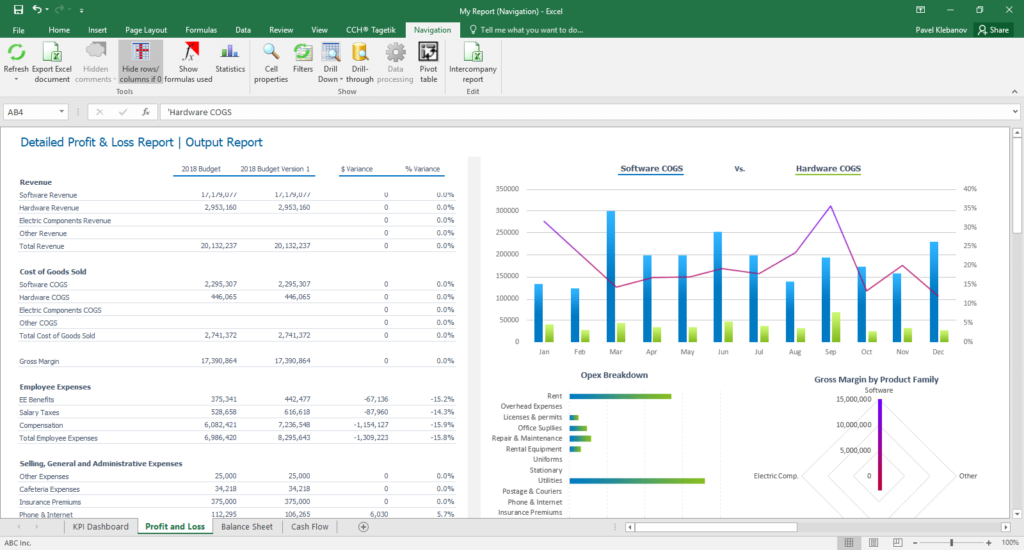
Below is an typical example of a spreadsheet that any given company might produces on a monthly basis. More often than not, a report of this type involves a quit a bit of manual effort. The raw data may come from two or three different sources, be in different formats and use different terminology to describe the same thing. All that has to somehow be incorporated and cleaned up before it can be used, that usually involves a lot of cutting, pasting and manipulation to get it into shape. The report itself probably relies heavily on complex Excel formulas, these have to be maintained because potentially, the data could change and the formulas may no longer work properly as written. Finally the report has to be reconciled against the source data to insure accuracy and if the numbers don’t tie, there could be a lot of rework and debugging necessary. So depending on the level of Excel knowledge and skill level of the preparer, this report might take hours to produce.
Using VBA, SQL and techniques I’ve developed over the years, this same report could be produced in seconds, with one or two clicks, by someone with little or no Excel knowledge. All the pulling together of data, cleansing, error checking and and reconciliation can be done automatically in the background, so all the user has to do is run it! The report can even be logically tested for problems and if any are discovered highlight them for you with explanations so problems can quickly resolved be resolved.
ERP Integration
Another thing I’ve been doing for many years is Excel/ERP integration using VBA and SQL.
No matter what type of ERP system you have, it runs on a SQL backend database and Excel can connect to it. This gives you the ability call up any data in your system and have it at your fingertips. I design intuitive user-friendly interfaces that allow you to get to information quickly and easily and get your answers to questions on the fly.

Pivot Tables On-demand
If you’re not using Excel Pivot Tables you should start now, because they are without a doubt, the best analytical tool for large datasets available, I use them every day and build them into practically every application I design.
A PivotTable is a powerful tool to quickly calculate, summarize, and analyze datasets that lets you see comparisons, patterns, and trends and answer unanticipated questions about the data. Pivot tables let you interactively group, sort, count, total or average and analyze the data from every angle and summary level. You can transform columns into rows and rows into columns. It allows grouping by any field (column), and using advanced calculations on them. All this is done on the fly and without changing underlying database itself, it simply “pivots” or turns the data to view it from different perspectives.
If you’re not all that familiar with them, creating pivot tables and knowing how best to structure them can be a little intimidating. So I have developed techniques that create them for you spontaneously, with just one click. I do all the setup work for you in the background so you can dive right into your analysis.
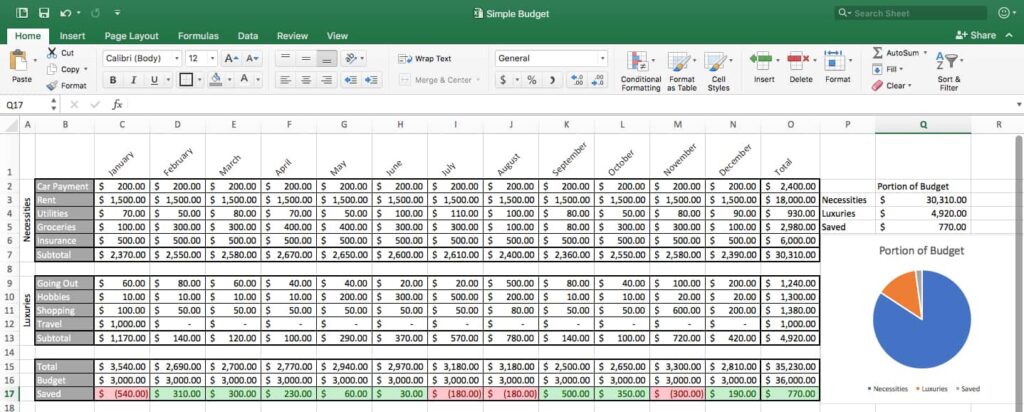
Custom Spreadsheet Formulas
We’re all familiar with the built-in Excel formulas such as SUM(), MIN(),MAX(), VLOOKUP() and so forth. These are great but they don’t always meet your specific needs. Getting the answer you want can often be achieved by combining the Excel formulas inside one another, this is called nesting. Nested formulas work, but if they get too complicated they become extremely difficult to write and very hard to read. If later on you have to make changes to them, rethinking the logic can be really difficult, you may even have to start from scratch. Then there’s the problem of making sure all the cells that use that formula have been updated properly, in an extreme case, you may end up having to debug the whole spreadsheet!.
These problems can all be solved by creating custom formulas. Custom formulas are used just like the standard ones, but are designed around your specific requirements. Basically, a custom formula puts a wrapper around all that complexity and gives you your own concise and descriptive formula that is simple to use, performs as well and has none of the maintenance problems.

MS Office Integration

Using VBA code Excel can call up any of the other Office products and use it just as you would do normally, only it happens behind the scenes a lot faster and more accurately. For instance you can run a calculation in Excel and pass the results to a Word document. Or by using conditional logic, Excel can evaluate which Word document template is proper to use based on the results. Excel can also call up Outlook, compose an email, attach the spreadsheet and send it out to the recipient, all in one pass without you having to do it. Or if you want to present the latest financial statements in a PowerPoint presentation, Excel can create and populate it for you, simply by clicking your mouse. In other words, I can build a system for you that integrates all the Office products into one seamless user-friendly system that will save time and money.
- Knowledge Base
- Performance
- Value
Business Intelligence

Until recently the digital tools needed to analyze and visualize large enterprise datasets were available only to large companies, this is no longer true. The technology behind Microsoft’s Power Platform has brought the cost of BI down to a level any size company can afford. I can help you take advantage of this, and give you the power to make better, more well-informed decisions.
I have over 20 years of experience designing BI analytical and visualization systems. The BI system I most often recommend for my clients is Microsoft Power BI. Power BI is the number one BI platform in the world, it allows me to give my clients the ability to make well-informed decisions and gain powerful new insights through interactive dashboards. It gives them the ability to have their financial, operational and business development information available to them in one normalized data source. And because Power BI operates in the cloud, they can access this information from anywhere on any device.
But my favorite Power BI feature is the fact that it delivers, just as I do, top-tier performance at a price almost any size company can afford.
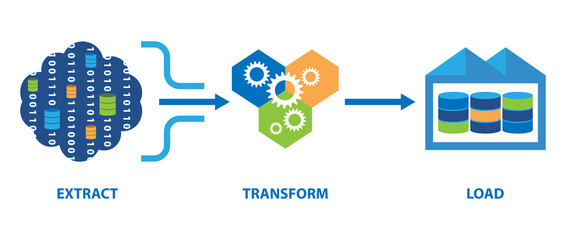
The first step in creating business intelligence, is a process known as ETL, it stands for “Extract, Transform, and Load”, it is the process of collecting data from your various databases and silos, and consolidating it into a single, consistent data source that can be easily accessed and used by a designated group.
To do this, you need to first extract it from its original source, this might anything from ERP system, to an Excel spreadsheet or text file. The data might come from another entity as part of a business merger, from such as a business partner, vendor or outsource service. You next need to transform the data by cleaning it up, deduplicating it, combining it, putting it into a consistent format to prepare it for the final step, which is to load it into the target database.

In the many years that I’ve been doing ETL the technology has improved greatly, but even better, the cost of ETL has gone down dramatically. Data warehousing data modeling was once only available to large companies with big IT budgets, now with the introduction of Microsoft’s Power Platform suite of products, this ability is within the reach of almost any size organization.
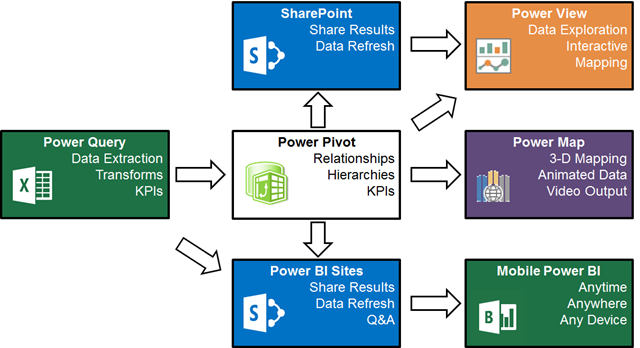
Today, my ETL tool of choice is Microsoft Power Query, which is the data transformation and mash up engine that supports the Microsoft Power Platform. It enables you to discover, connect, combine, and refine data sources to meet your all your analysis needs. It can allow you to connect to virtually any data source, including any type of SQL database, Excel, Access, online services such as Dynamics 365 and Google Analytics, JSON, CSV, .TXT,.XML or PDF files and many more.


As part of the same process, Power Query allows you to transform the data prior to loading it. Virtually any type of clean-up or normalization of the data can be done with Power Query. In addition the transformation process is automatically saved so that can be reused as often as needed.
The last step in the ETL process is to load the data into the data model. The powerful data compression engine Power Query uses makes it possible to store many millions of rows of data with out degradation of speed or functionality.

The next key BI component is data modeling, this is done in Microsoft Power Pivot. Data Modeling is fundamental to the BI process, it defines the relationships or connections between all the different data.
Data modeling also involves creating measures. Measures are the quantitative the statistics you want from your data, things like total sales,
number of employees, net profit by region, etc. Basically, they are the things you need to know to track the performance of your business, so they are also known as Key Performance Indicators, or KPI.
Power Pivot is also used by Excel, to create Pivot Tables. Pivot Table analysis is one of the most powerful ways to gain insight into what is happening in the business. Because of the improvements Microsoft has made in their data compression engine, Pivot Tables are even more powerful than they have been in the past because they can now be used to analyze much larger data sets.